Purpose
Purpose of this post is to describe the Software Project Audit Process which is capable of capturing different activities which take place throughout a Software Project life-cycle. The main purpose of this process is to audit the quality of the deliverables at the client site. After the auditing, the quality level of the audited activity will be presented using a measurement called Metric.
The process will be used by both the Development team and the Software Project Audit team to derive their own metrics to measure the quality status of a software product in its life cycle. Eventually, the trends of such metrics will be used to predict or change the Projects’ way forward by identifying any potential failures which can happen in the future.
Also in this post i will explain the several guidelines used by the Software Project Audit Process for Project Progress calculation, mapping Payment Milestones with Project deliverables and Project Artifact reviewing.
Further, it will explain the way how the process differ from typical software development life cycle and how it has been automated by integrating several testing tools and testing methodologies as well as embedding best industry standards.
Scope
Scope of this post is to provide an insight about ;
- Software Project Audit Process
- Importance of Metrics
- Analysis of Metrics
- Automated Process of Metric Generation
- Skills required to generate certain Metrics
- Guideline for Project Progress Calculation
- Guideline for Mapping Payment Milestones with Deliverables
- Guideline for Review of Project Artifacts.
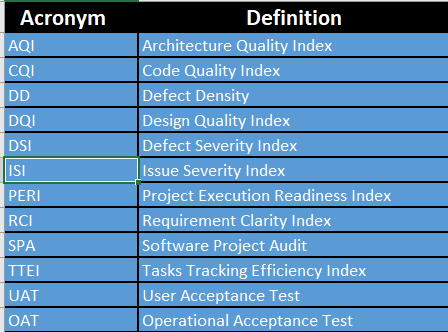
Definitions, Acronyms and Abbreviations
Process Overview
It is often said that if something cannot be measured, it cannot be managed or improved. There is immense value in measurement, but you should always make sure that you get some value out of any measurement that you are doing.
What is a Metric?
It is a standard of measurement which can be used to measure the software quality. It gives a confidence in the software product. They are typically the providers of the visibility of the Software Product you need.
Why Measure?
When used appropriately, metrics can aid in software development process improvement by providing pragmatic, objective evidence of process change initiatives. Although metrics are gathered during the test effort, they can provide measurements of many different activities performed throughout a Project. In conjunction with Root Cause Analysis, Test Metrics can be used to quantitatively track issues from points of occurrence throughout the Development Process. In addition, when metrics information is accumulated, updated and reported on a consistent and regular basis, it ensures that trends can be promptly captured and evaluated.
What to Measure?
When considering the metric driven process, it can be divided into two parts. The first part is to collect data, and the second is to prepare metrics/charts and analyze them to get the valuable insight which might help in decision making. Information collected during the Software Development Process can help in:
- Finding the relation between Data Points
- Correlating Cause and Effect
- Input for Future Planning
Normally, the metric driven process involves certain steps which are repeated over a period of time. It starts with identifying what to measure. After the purpose is known, Data can be collected and converted into the metrics. Based on the Analysis of these metrics appropriate action can be taken, and if necessary metrics can be refined and measurement goals can be adjusted for the better.
Data presented by Development/Testing Team, together with their opinion, normally decides whether a product will go into client or not. So it becomes very important for Development Team/Test Teams to present Data and opinion in such a way that Data looks meaningful to everyone, and decision can be taken based on the Data presented. Every Software Project should be measured for its schedule and the Quality Requirement for its release. There are lots of charts and metrics that we can use to track progress and measure the quality requirements of the release. The below figure shows some of the main metrics which can be derived at specific level of the Software Development Life-cycle.
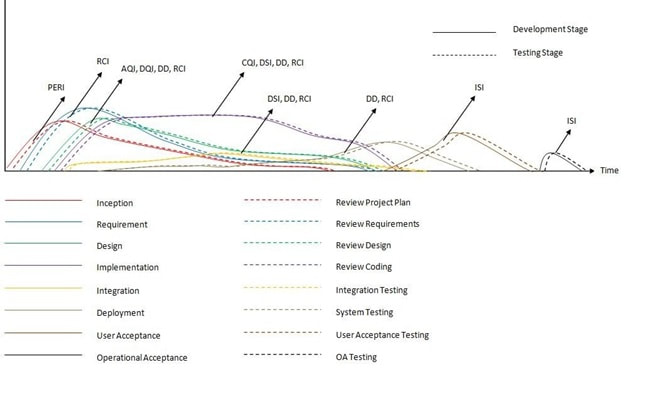
Various Metrics derived at different levels of Software Development Process
Metrics in Brief
Metrics Analysis
Much as the time is spent gathering or maintaining metrics, enough time should be spent to review and interpret on a regular basis throughout the test effort, particularly after the application is released into production. During review meetings, the project team should closely examine all available data and use that information to determine the root cause of identified problems. It is important to look at several metrics, as this will allow the project team to have a more complete picture of what took place during a test.
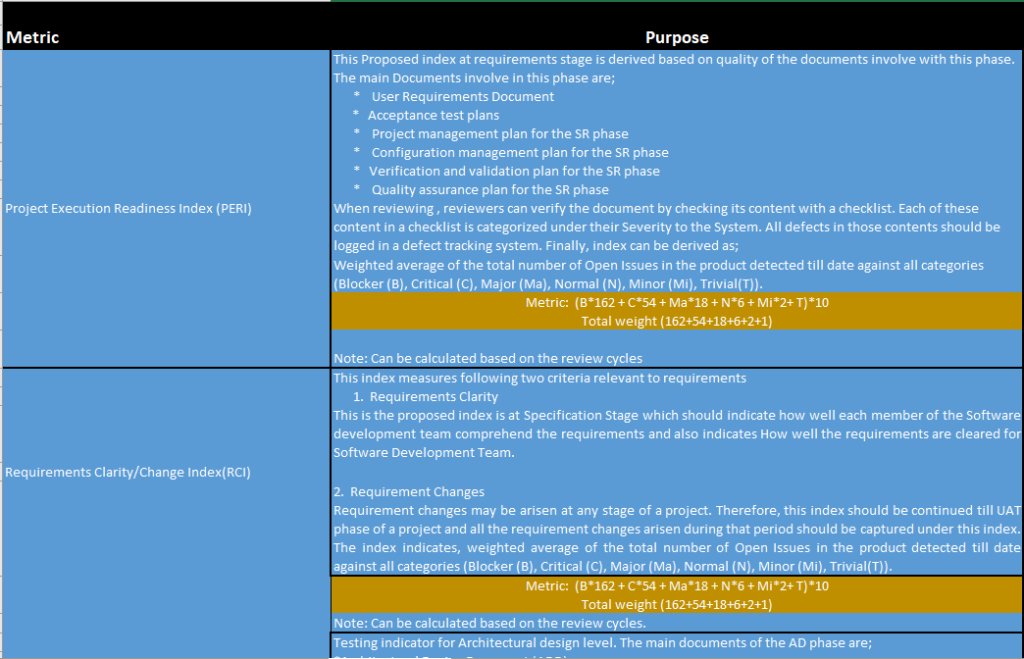
Let’s assume that as part of the Software Project Audit Process, the following metrics are collected by the SPA team.
| Metric | Purpose |
| Defect Severity Index | Weighted average index of the Severity of defects. A higher severity defect gets a higher weight. S1 is a show stopper, S2 is high severity, S3 is medium & S4 is low. Ideally, this should slope down as test cycles progress |
For instance, if the test team has generated the following metrics:
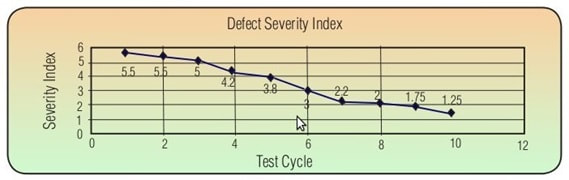
Looking at the graphs one can safely deduce the followings;
Defect Severity Index Trend
What does the graph indicate? The defect severity index is sloping down consistently. This indicates an increasingly favorable trend. As the test cycle progresses (from cycle 1 to cycle 10), the severity index is sloping which suggests increasing quality of the application (as lesser number of critical and high severity defects are being reported).
This is what it could mean: While a fall in the defect severity index is definitely a good trend, looking at this index in isolation could be misleading. Following factors need to be considered in order to have a meaningful analysis.
Number of defects logged – let us consider an example where the test team executed two cycles of testing (assuming other things as constant). The number of defects logged against each of these cycles along with the calculated severity index is shown below.
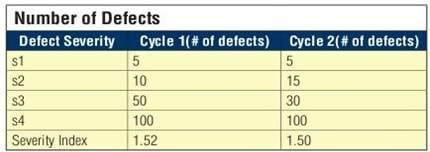
At first thoughts, when we compare cycle 1’s Severity Index with cycle 2’s Severity Index, cycle 2 looks to be favorable (as the severity index is lower). If you go into the details of the number of defects logged and their severity, the picture turns out to be the opposite. While the total number of Severity 1 and Severity 2 defects for cycle 1 is 15, the number of Severity 1 and Severity 2 defects for cycle 2 is 20. In terms of quality, cycle 1 is better than cycle 2 as cycle 1 has lesser number of high severity defects (though the total number of defects logged in cycle 1 is more than cycle 2 defects and the severity index is greater than cycle 2 severity index). Test coverage has a similar impact. A lower test coverage coupled with reducing severity index would not be a healthy trend.
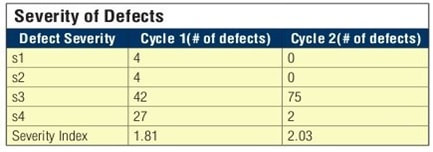
Defect Severity – let’s consider another example where the test team executed two cycles of testing (assuming other things as constant). The severity of defects logged against each of these cycles along with the calculated severity index is shown below.
Looking at the severity index, it looks like cycle 1 is better than cycle 2 (as the severity index is low for cycle 1 compared to cycle 2). However, cycle 2 is better than cycle 1 as total number of Severity 1 and Severity 2 defects is zero compared to a total of 8 severity 1 and severity 2 defects of cycle 1. Just because the severity index is low, do not believe the quality of the application is better than the earlier cycle.
Process Automation
Here i will describe about the testing methodologies, process and tools to be used while automating the typical software development life-cycle in order to deriving the metrics.
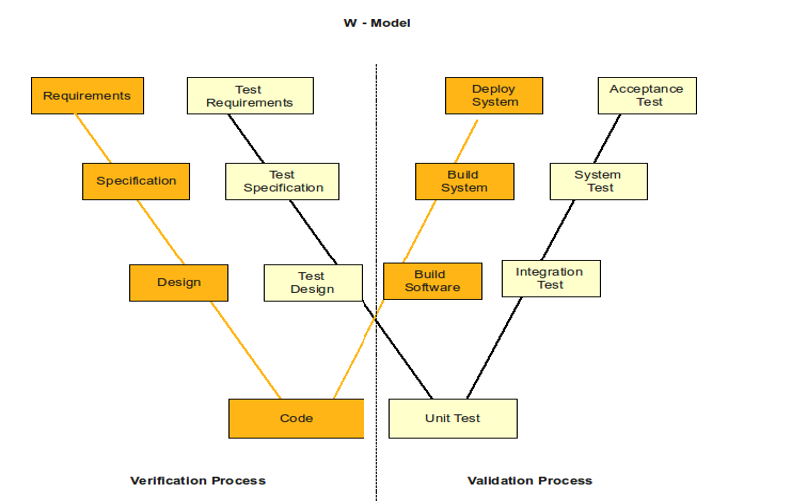
Testing Methodology
According to the Automated testing process, every development activity is mirrored by a test activity. The testing process follows a well-proven testing methodology called W-model. Following picture explains, the way of testing activities of W-model involve with the standard software development life-cycle.
While the execution of the project, either developers or SPA team can generate the related metrics.
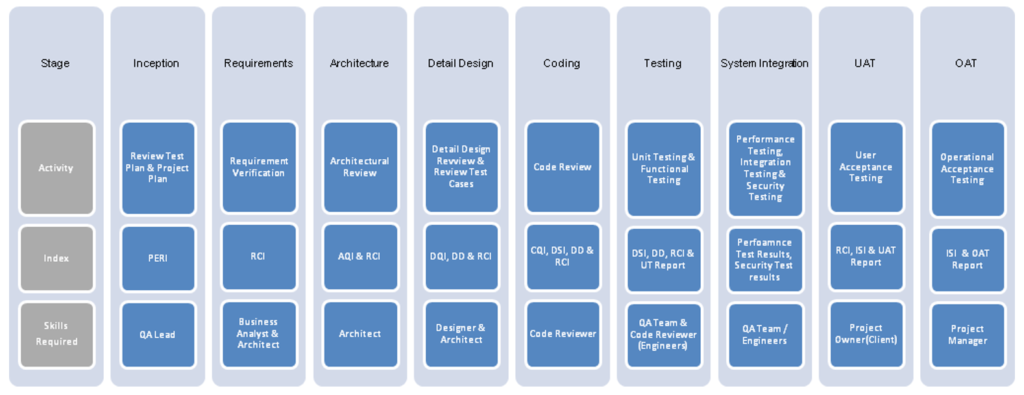
Skills Required to Generate Metrics
During the different stages of a software project, several roles and parties will be involve with development, reviewing and testing activities. Below image shows the different stages of a software project, the main activities which should perform during those stages, the roles/parties should involve and the metrics which derive and maintain in those stages
Process of Setting Up a Metric
The life-cycle of a Metric or the process involved in setting up the metrics:
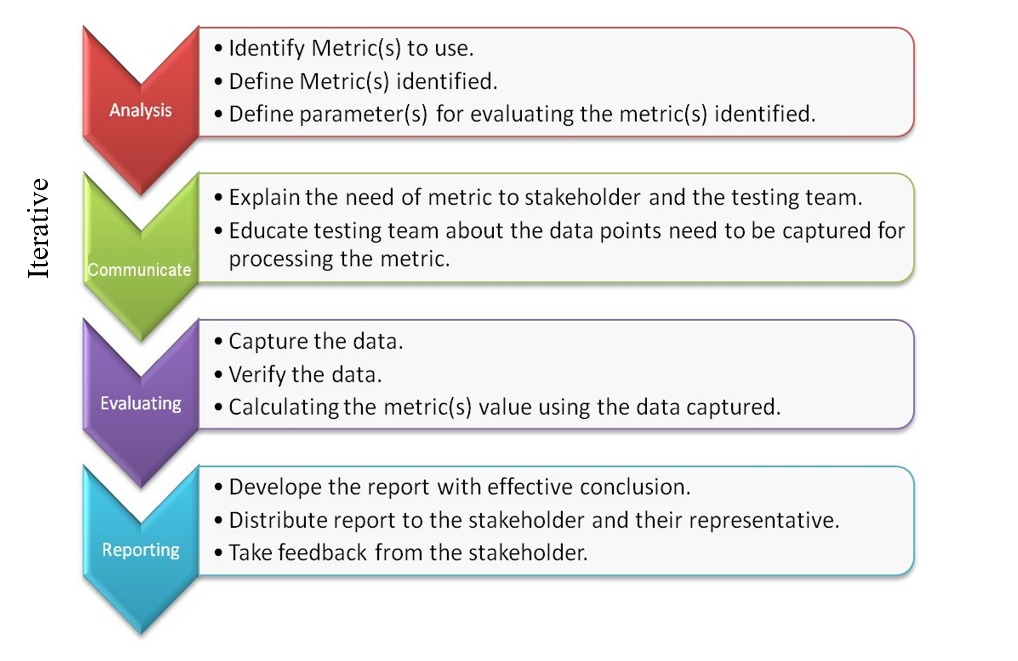
When implementing this process, several testing tools and techniques can be used along with the automated testing process in order to generating, maintaining and evaluating the metrics derived at specific level of the Software Development Life-cycle.
Integration of Testing Tools / Process
Below you find a list of tools /process which can be used when automating the typical SD life-cycle suits to the Software Project Audit Process.
- Fagan Inspection – Fagan Inspection defines a process as a certain activity with a pre-specified entry and exit criteria. Activities for which Fagan Inspection can be used are:
- Requirement specification
- Software/Information System architecture (for example DYA)
- Programming (for example for iterations in XP or DSDM)
- Software testing (for example when creating test scripts)
- Cruise Control – It is both a continuous integration tool and an extensible framework for creating a custom continuous build process. It includes dozens of plug-ins for a variety of source controls, build technologies, and notifications schemes including email and instant messaging. A web interface provides details of the current and previous builds.
- Team City – is a Java-based build management and continuous integration server package. Its Server-based application that’s very simple and easy to get familiar with and has an absolutely amazing browser-hosted dashboard. TeamCity also provides build progress, drill down detail, and history information on the projects and configurations. It also supports the version control systems like SVN, CVS, Git etc.
- Jenkins – is a Continuous Integration server to practice running your tests on a non-developer machine and automatically compile every time someone pushes new code into the source repository. This has the tremendous advantage of always knowing if all tests work and getting fast feedback. Built on top of Continuous Integration are Continuous Deployment/Delivery where after a successful test run your instantly and automatically release the latest version of your codebase. Makes deployment a non-issue and helps you speed up your development.
- Bug-zilla – It is a Web-based general-purpose defect tracking and testing tool.
- SVN – It is a revision control system which use Subversion to maintain current and historical versions of files such as source code, web pages, and documentation.
- Git – Git is a free & open source, distributed version control system designed to handle everything from small to very large projects with speed and efficiency.
- SCM – For Configuration identification and Identifying configurations, configuration items and baselines. Also for Configuration control ,Configuration status accounting and Configuration auditing
Guideline for Review of Artifacts
Software Project Audit Process is not a QA process. It is an Audit of the quality of the deliverables at the client site
Industry Guideline on Defects

Acceptance Rejection of Deliverables
An acceptable client delivery should be 3-4 defects without any blocker, critical or major issues. If there are any known issues with the delivery.
Any client deliverable will be prone to rejection under following scenarios. In a client deliverable if there is;
- One blocker issue
- Two critical issues
- One critical and 4 major issues
- Eight major issues
In such situation, the SPA team should stop the review and bring that to the attention of Project Stakeholders.
Increasing Defect Severity
It is required to increase the severity of a defect by the SPA team, if the defect was kept open for more than 1 month. The Defects with “Differed” status should not be changed.
NOTE: Automatic update of defect severity should be added to the SPA dashboard, till then, SPA team needs to update the defect severity manually in any preferred way they feel comfortable with.
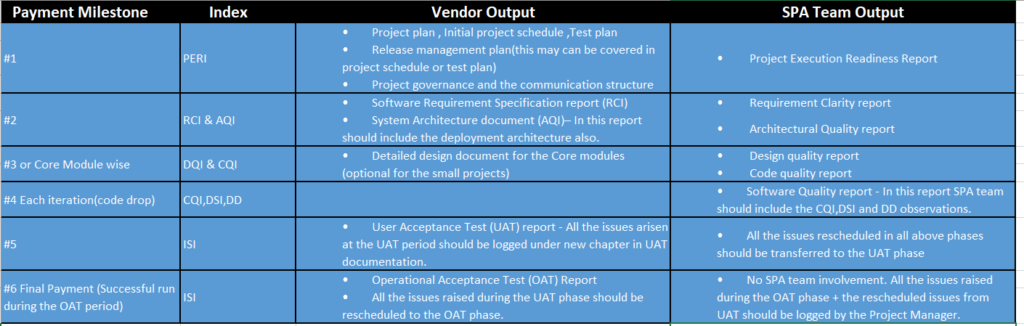
Payment Milestones
The metrics discussed above are directly linked with payment milestones of a project. Below Table describes the several output documentations needed to be provided by both vendor and the SPA team at such payment sign off point.
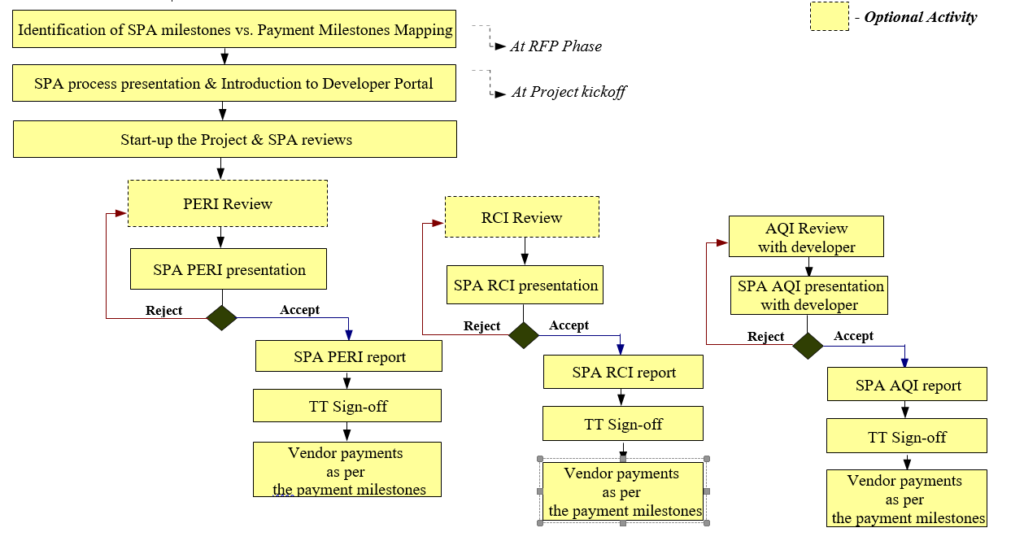
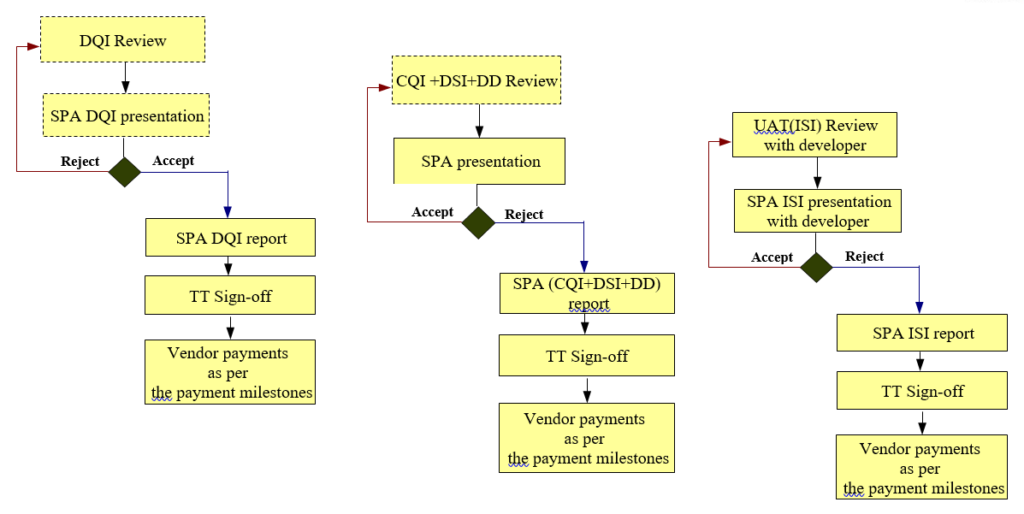
Software Project Audit Process Flow
Guideline for Project Process Calculation
In Software Project Audit Process following methodology is used for calculation of Project Progress.
- Any software project consists of several payment milestones. Each payment milestone consists of one or more deliverables.
- A payment milestone is an indication of some percentage of the project progress.
- Each deliverable indicates equal percentage completion of relevant payment milestone.
- At the beginning of a project, all the possible payment milestones and their deliverables should be identified and updated to the SPA Dashboard.
- For monitoring purposes, progress of a deliverable is considered as the basic element of measurement when calculating project progress.
- The SPA process defines 05 steps life-cycle for a deliverable. Below Figure illustrates those steps and a percentage completion for each steps.
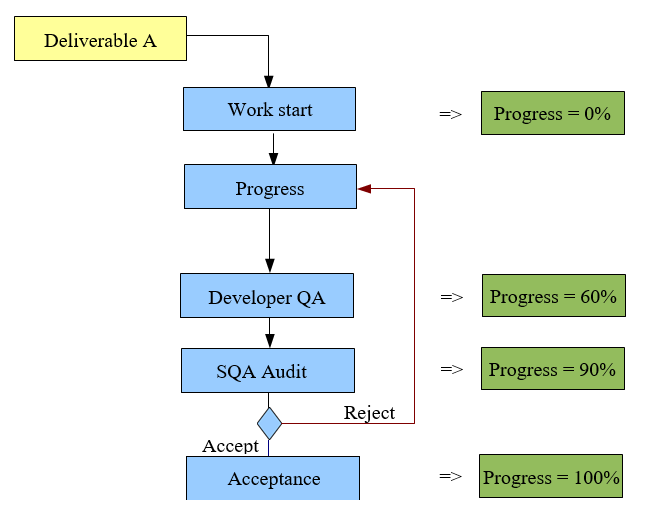
- Depending on the stage of a deliverable, its progress should be updated to the SPA Dashboard by the Project Manager.
- Finally, the progress of a payment milestone and the total project progress will be calculated by the system as follows;
Payment Milestone Progress
Suppose a payment milestone which consists with n no. of deliverables called D1, D2, D3, … , Dn. If the respective progresses of those deliverable are as P1, P2, P3 … , Pn, then the total progress of the payment milestone can be calculated as follows;
Payment Milestone Progress %
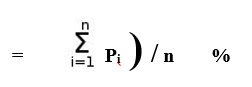
Assumption: Each deliverable indicates equal percentage completion of a relevant payment milestone.
E. g: Assume a project with 2 deliverables called D1 and D2 . The current statuses of those deliverables are as follows;
| Deliverable | Current Status | Progress% |
| D1 | SPA Review | 90 (P1) |
| D2 | Developer QA | 60 (P2) |
Then the progress of the payment milestone can be calculated as follows;
Total progress of the payment milestone = (90 + 60) / 2 %
= 75%
So it can be concluded that the payment milestone is 75% completed.
Total Project Progress
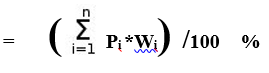
Suppose a project consists with n no. of payment milestones called M1 , M2 , M3 , … , Mn and their respective weightages are as W1, W2, W3, … , Wn. If the respective progresses of those payment milestones are as P1 , P2 , P3, …, Pn , then the total progress of the project can be calculated as follows;
Total project progress = ((P1 * W1) +(P2 * W2) +(P3 *W3)+ … + (Pn * Wn) ) / 100 %
E. g: Consider a project with 5 payment milestones called M1 , M2 , M3 , M4 and M5.
| Payment Mileston | Weightage % | Progress % |
| M1 | 10(W1) | 90 (Pa) |
| M2 | 20 W2 | 80 (Pb) |
| M3 | 40 W3 | 90 (Pc) |
| M4 | 25(W4) | 75 (Pd) |
| M5 | 5 (W5) | 40 (Pe) |
then the total progress of the project can be calculated as follows;
Total progress of the project = (90*10 + 80*20 + 90*40 + 75*25 + 40*5)/100 %
= 81.75%
So it can be concluded that the Project is 81.75% completed.